
Claude Whiteboards, Sheets, and Data: What Anthropic's New Office Layer Actually Does
Most teams already know the shape of the problem. You talk through a launch plan with an AI assistant, get a genuinely useful answer, and then the real work starts: copying it into a whiteboard tool so colleagues can see it, rebuilding the numbers as a spreadsheet, screenshotting a chart into a slide deck, and explaining the whole thing again in the next chat because the assistant never saw any of those artifacts. Anthropic describes its own motivation the same way: work with Claude often meant moving output into another program where Claude had no live access to follow progress and changes.
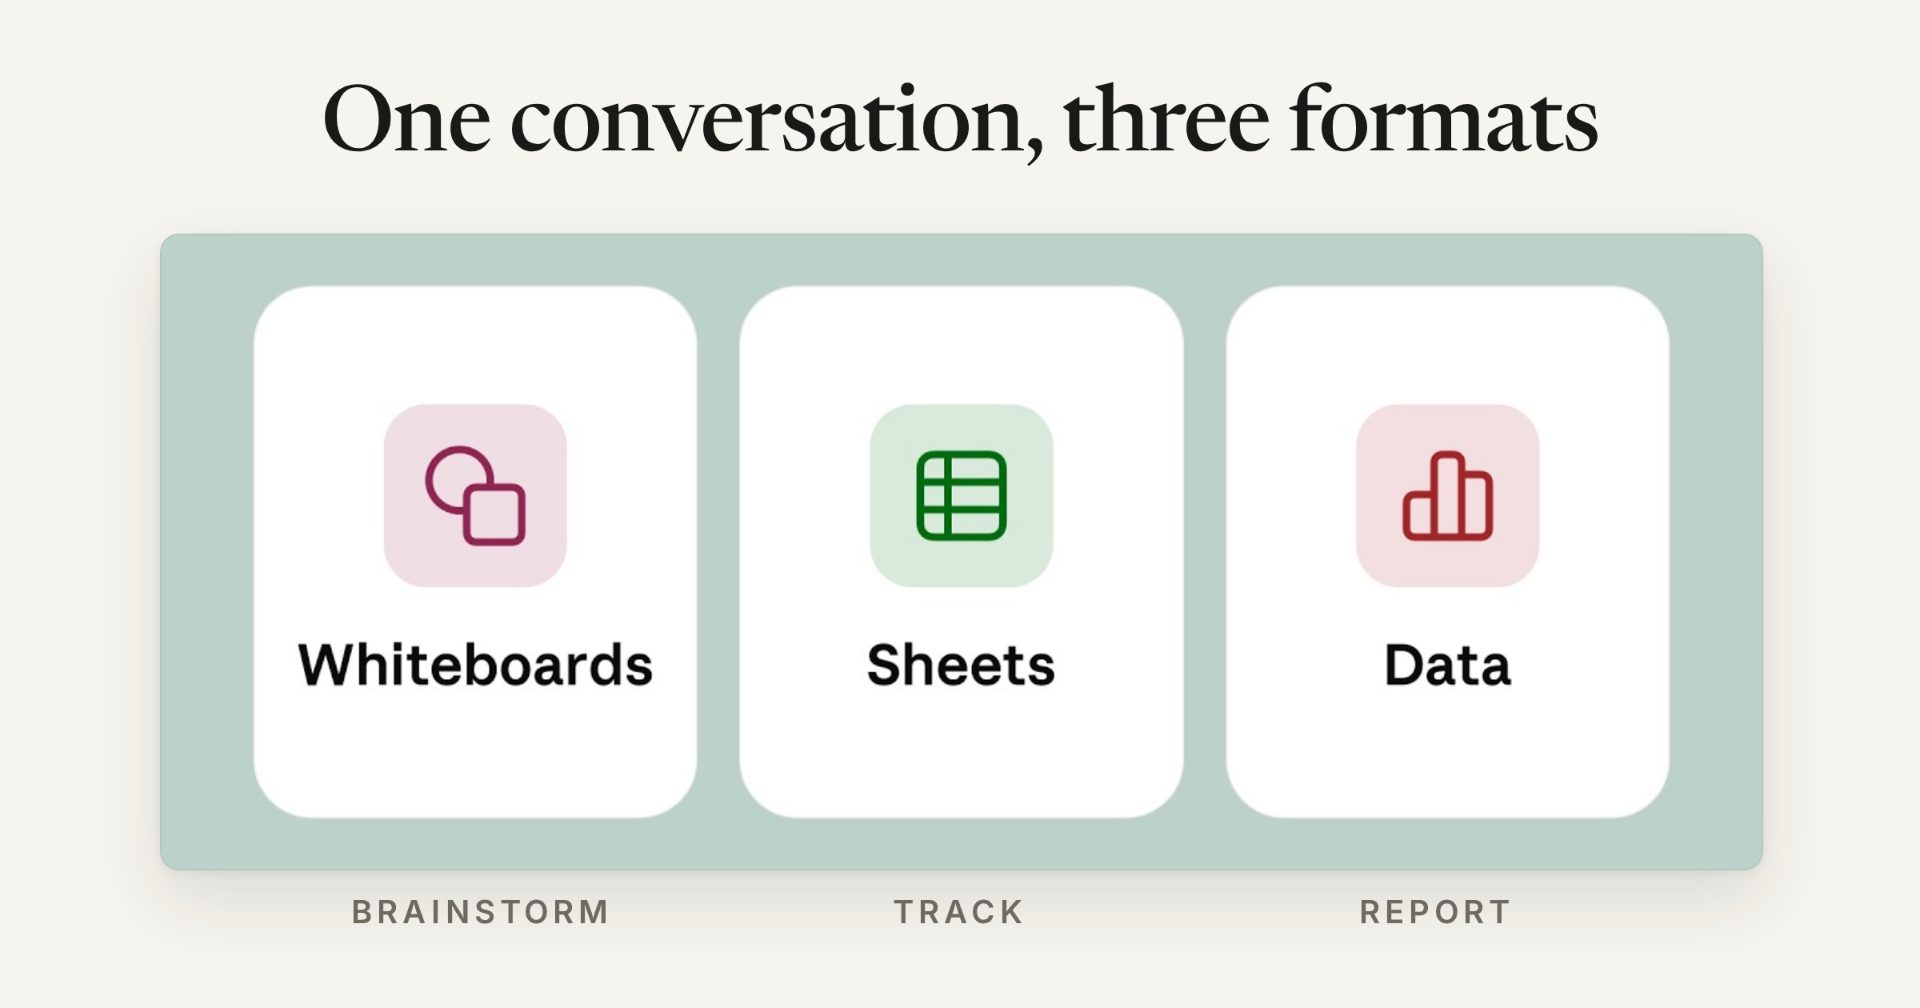
On November 10, 2026, Anthropic shipped three products aimed squarely at that gap. Claude Whiteboards and Claude Sheets arrived in beta, and Claude Dashboards, which had been in beta since October, graduated to general availability under a new name, Claude Data. All three run on paid plans across web, desktop, and mobile. Together with the existing Docs, Slides, Design, and Motion artifacts, they turn Claude from a chat window into something closer to a lightweight office suite, with a shared context layer underneath.
This article explains what each tool actually does, how the mechanics work under the surface, where the beta limits are real, and how to sequence the three without turning them into another set of tabs nobody opens.
What shipped, and who gets it
| Tool | What it does | Status | Availability |
|---|---|---|---|
| Claude Whiteboards | Shared canvas where Claude turns discussion into timelines, groups, and owners | Beta | All paid plans |
| Claude Sheets | Prompt-built spreadsheets with tabs, formulas, formatting, and drop-downs | Beta | All paid plans |
| Claude Data | Dashboards, certified metrics, data stories, and live sharing on connected data | Generally available | All paid plans, needs a data connector |
One detail worth noting: a fourth announcement, Claude Meetings, is described by press reports as a Team and Enterprise beta working with Google Meet, while Anthropic's own product pages still call it coming soon. If you are planning around it, check your account rather than a launch recap.
Claude Whiteboards: the messy first thirty minutes, with a destination
A whiteboard in Claude is an artifact, the same container type that holds docs, slides, and dashboards. Claude draws what you describe using shapes, arrows, and sections, and everyone on the board can rearrange it. You start one either by asking in a chat or by picking the Whiteboard tile in the Artifacts tab.
The feature that changes how a meeting feels is dictation. Select the microphone next to the send button, talk through a half-formed plan, and Claude groups related ideas, orders the steps, and connects the ones that depend on each other. Dictation follows your browser's language and, according to Anthropic's help documentation, works across 25 languages. Anthropic's own example is a plan spoken aloud that comes back as a board with a timeline, owners, and dates.
Three interaction patterns do most of the daily work:
- Reorganize. Ask Claude to regroup by theme or convert the board into a timeline. This is the sticky-note-sorting step that eats the last fifteen minutes of a retro.
- Find gaps. Ask what is missing between two steps. Claude adds suggestions to the board for you to check rather than silently rewriting your plan.
- Focus on a region. Drag a box around part of the board and ask about only that area. On a crowded retro board, "what is the real blocker in this cluster" is a better question than "summarize everything."
Collaboration is live. Board participants can move things around, and you can follow a teammate around the canvas to see what they are looking at. Sharing works through the same artifact sharing system as other Claude outputs, with the usual caveat that on Team and Enterprise plans, email invitations outside your organization must be enabled in Organization settings before outside guests can join.
The exits matter more than the board
Anthropic made a clear design choice: boards flow out, not in. When the thinking settles, you can ask Claude to turn the board into a document or a slide deck, send it to Lucid, Miro, or Vani by Zoho, or export a PNG snapshot. What you cannot do is import an existing board from a file.
That one-way flow tells you what the product is for. Whiteboards is the front of a pipeline that ends in a doc, a deck, or a tool your team already pays for. It is not trying to be the place a board lives for six months, and Lucid's own launch post frames the handoff that way: the board opens as an editable Lucid document ready for the deeper diagramming, voting, and permission controls that a dedicated visual collaboration platform provides.
If your team already standardizes on Miro, that handoff is a feature, not a limitation. It means the brainstorm step can happen where the conversation already is, without forcing a migration.
Where Whiteboards stops
Anthropic is unusually direct about the beta constraints, and three of them shape real use:
- No connected-app context. Claude works from what is on the board and does not pull from your connected apps. If you want last month's ticket themes on the board, you gather them in a chat first and bring them in yourself.
- Data controls. Whiteboards is not available to organizations with HIPAA-ready configurations. In organizations with zero data retention for Claude Code, it works in chat and Cowork, is not covered by zero data retention, and is not available in Claude Code.
- Usage. Boards count toward your plan's usage limits like any other work with Claude. A long dictated retro with several rounds of regrouping is meaningfully more expensive than a five-box diagram.
Claude Sheets: a fast working file, not a financial model
Sheets starts from a prompt. Ask for a campaign tracker or a hiring budget and Claude generates a spreadsheet with multiple tabs, formulas, formatting, and drop-down menus. It then edits cells alongside you, outlining each change so you can see exactly what moved. Anyone with editing access can work in the same file, and Claude's edits are annotated for the team to track.
A prompt that reliably produces a usable starting point looks roughly like this:
Build a campaign tracker with one tab for tasks and one for budget.
Include a status drop-down (Not started, In progress, Blocked, Done),
an owner column, a due date column, and a formula on the budget tab
that totals spend by category and shows remaining budget.
That structure works because it specifies the tabs, the columns, the allowed values, and the calculation. Vague prompts produce vague sheets, and the difference between a useful tracker and a rebuild is usually a sentence or two of specificity.
The important framing comes from Anthropic itself: for now, sheets have simple spreadsheet functionality, with more planned. Reported help-center details put a ceiling of 100,000 cells per sheet, and mobile access is largely read-only for the moment. When you need real spreadsheet horsepower, the intended paths are exporting to .xlsx or CSV, using Claude for Excel to work inside Excel itself, or continuing in partner tools such as Airtable, Asana, monday.com, or Smartsheet. Anthropic's Google Workspace plugin support also means many teams will run Sheets and Google Sheets side by side rather than choosing.
A practical rule that falls out of those limits: put trackers, budgets, and first drafts in Claude Sheets, because the value is having the team and the assistant in the same file with the same context. Put anything with heavy pivot tables, macros, or multi-year modeling in Excel, and export early rather than late. Test the export before you depend on it.
Claude Data: what changes when dashboards become a product
Claude Data is the renamed Claude Dashboards, and the rename carries the strategy. Anthropic's explanation is that companies use their data in ways broader than dashboards, so the product now covers metric definitions, narrative reporting, and controlled sharing rather than just charts on a page.
Getting started requires a data connector, such as a warehouse or CRM. Anthropic names Amazon Redshift, BigQuery, and ClickHouse among the sources, and ongoing coverage adds Snowflake, Databricks, and Salesforce. No connected data means no dashboard, which is the single gate that determines whether the product applies to you at all.
The six additions since the beta
The generally available version adds capabilities that address real friction in analytics work:
- Certified queries. A data team can certify the metric definitions everyone should use, and charts built on them carry a certified badge. This is the fix for two dashboards reporting two different revenue numbers.
- Data stories. Claude can draft a written narrative or a narrated video from your metrics, which you review before anyone else sees it.
- Live sharing. Colleagues opening a shared dashboard see current numbers even without access to the connectors behind it. Viewers see the results of approved queries and cannot run other queries with your access.
- Design systems. Dashboards can match your organization's visual identity.
- Caching. Dashboards no longer reload from scratch on every open, and refresh cadence can be set per dashboard.
- Tracked changes. You can see who edited what and roll back to a specific version.
The last two are less glamorous than the first two and arguably more important for adoption. Reload-on-every-open made dashboards feel slow enough that people stopped checking them, and version history is the difference between experimenting and risking someone else's work.
Under the hood: extracts versus live queries
The mechanics of a Claude dashboard explain most of its governance behavior. Each dashboard consists of a page plus one or more datasets listed in a Sources pane. A dataset is a single table with a title, an optional description, and a source, and it can be either a file extract or a live connection.
The distinction has real consequences:
| Connection type | What happens | Refresh | Who can see the data |
|---|---|---|---|
| Extract from a local or remote connector | Claude pulls rows as files to build the chart | Re-extraction during editing | Anyone who can open the dashboard can read the extracted files |
| Live query through a remote connector | Each visual binds to a query that reruns | Refresh button reruns current queries | Each query runs with the viewer's own connection and permissions |
Early hands-on reviews of the dashboard product flagged two practical issues that follow from this. First, the interface does not clearly distinguish live dashboards from extract-based ones; the visible cue is often just a refresh button, so verifying means opening a number and inspecting its query. Second, extract-based dashboards carry a distribution question: if anyone who can open the dashboard can read the underlying files, sharing the artifact is effectively sharing a data snapshot, not just a view.
Those are the sorts of details that matter when you move from a personal BI experiment to a team workflow, and they reinforce a simple operating rule. If a dashboard needs to be trusted and current, build it on remotely hosted connectors that support live queries, and check how freshness is exposed before you circulate it.
Data residency and retention deserve their own review as well. Reporting at the time of the dashboards beta noted that Claude plans did not include EU data residency or zero data retention for the apps where dashboards are built, with zero data retention agreements covering the API and Claude Code. Verify the current terms for your contract before pointing Claude Data at regulated data.
The part that ties it together
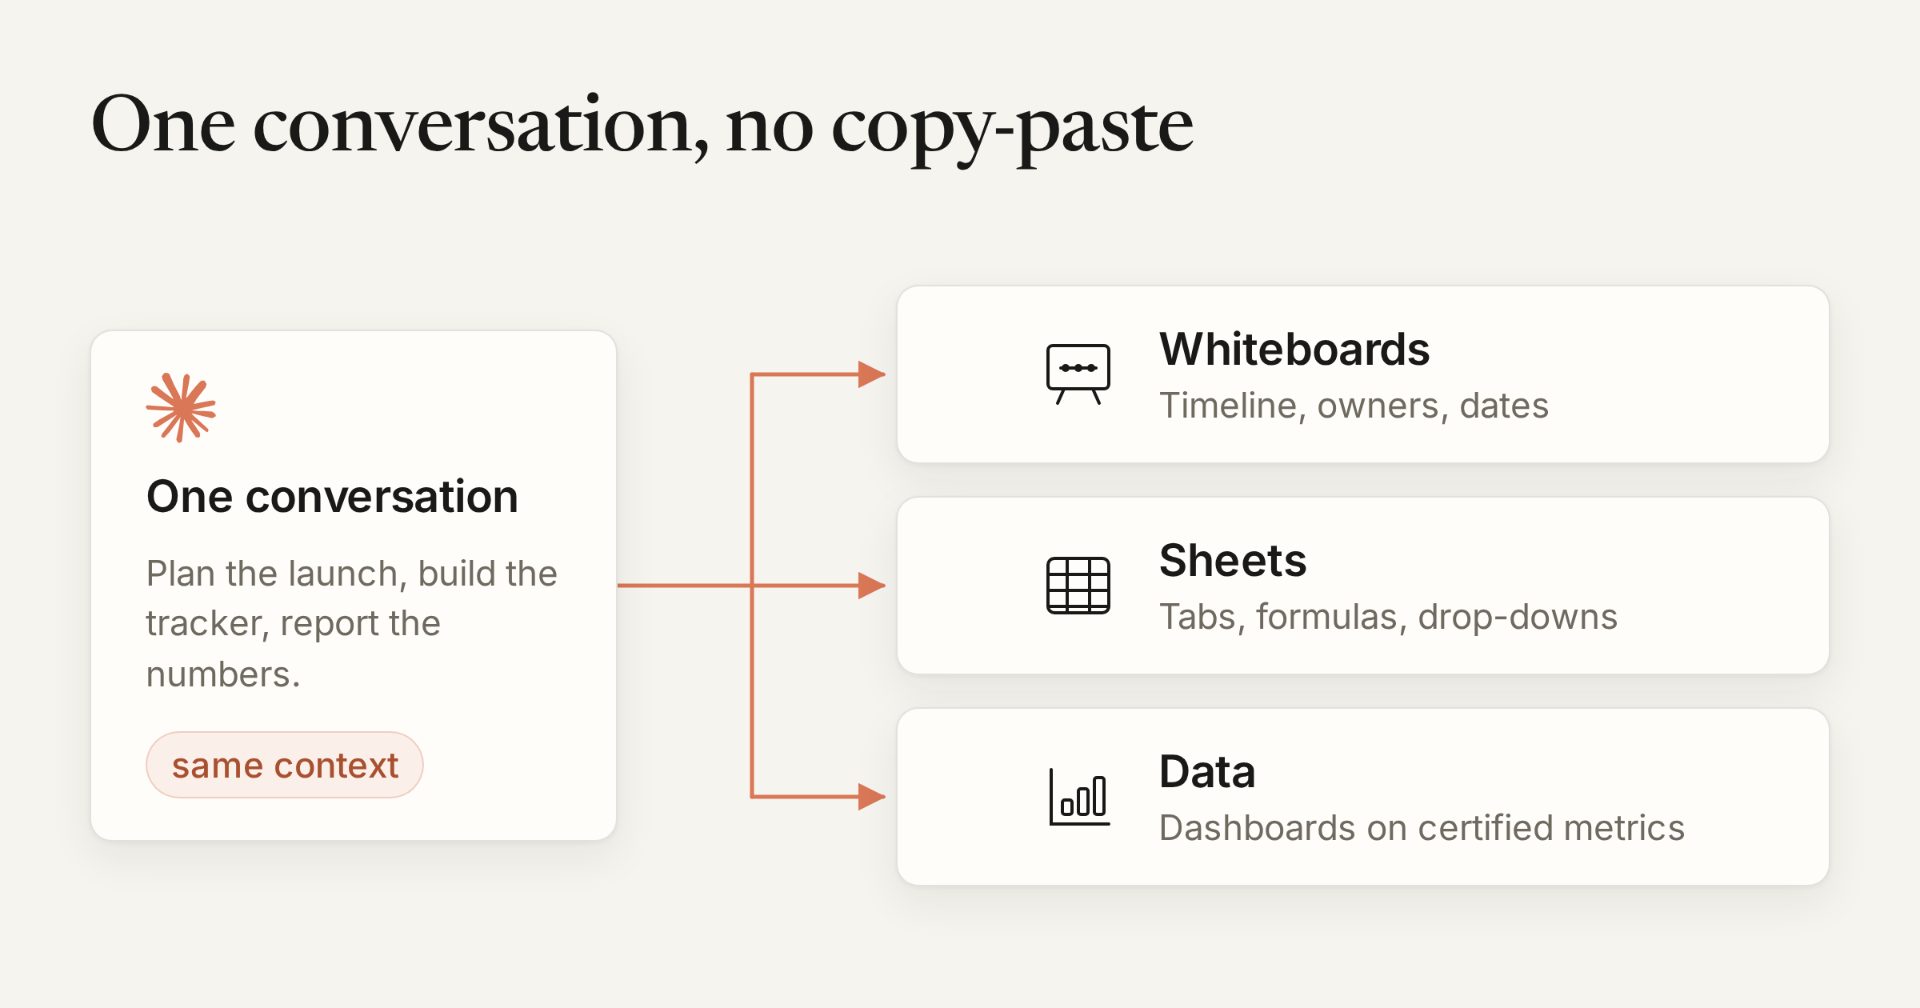
The individual features are less interesting than the continuity. Claude keeps the same conversational context across artifacts, so an idea explored on a whiteboard becomes the sheet, and the sheet informs the dashboard, without re-explaining the project at each hop. That is the difference between three tools and one workspace, and it is why the launch framing emphasizes working at the speed of thought rather than feature parity with Excel or Tableau.
Anthropic also expanded interactive connectors in the same release. Partner apps such as Adobe, Atlassian, Box, and Notion can open as full applications beside a conversation or in full screen, so you can edit directly or ask Claude to make changes while you watch. Existing connector permissions and action approvals still apply. This matters for the three new tools because it keeps the source material reachable: a Confluence page, a Notion database, or a PDF can sit next to the work instead of being pasted into it.
Rolling it out without surprises
The defaults differ by plan, and they are not uniform across the three products, which is the detail most likely to catch an admin off guard.
| Plan | Whiteboards | Sheets | Data |
|---|---|---|---|
| Free | Not available | Not available | Not available |
| Team | On by default | On by default | On by default |
| Enterprise | Off by default | Off by default | On by default November 19, 2026 |
Administrators change these under Organization settings > Artifacts at any time. The asymmetry is deliberate enough to plan around: whiteboards and sheets are opt-in on Enterprise because they are collaborative surfaces that touch organizational content, while Data is opt-out because it depends on connectors your organization has already governed.
A rollout sequence that avoids the common failures:
- Pilot with one team and one real project. Start a plan on a whiteboard, request the tracker as a sheet in the same conversation, and build the dashboard last if your data is already connected.
- Certify metrics before you build dashboards. Certified queries only help if the data team defines them before analysts fan out. Doing it afterward means retrofitting badges onto conflicting charts.
- Set refresh cadences deliberately. Caching is only an improvement if the cadence matches the decision the dashboard supports. A weekly operations review does not need minute-level refresh, and a live incident board should not be cached for a day.
- Use least-privilege connector accounts. Live queries run with the viewer's identity, so connector permissions become the real access control layer for anything shared.
- Test every exit before you commit. Export a sheet to .xlsx, send a board to Lucid or Miro, and confirm that the outputs open cleanly in the tools your team actually uses.
- Set meeting rules now. If you pilot Claude in calls, decide who can invite it, whether external guests are permitted, and where notes are stored, before the first customer call rather than after.
What this is, and what it is not
None of these tools replaces the specialist software in its category, and Anthropic does not claim otherwise. Sheets is explicitly simple for now. Whiteboards cannot import an existing board and does not read your connected apps. Claude Data is only as good as the warehouse and the connector behind it, and its governance model is still maturing.
The honest value is narrower and more useful than a suite replacement: the copy-paste step disappears. A plan, the tracker that operationalizes it, and the dashboard that reports on it can live in the same conversation, with the same context, and your team can edit all three together. For the quick tracker, the retro board, and the one-off question against a clean warehouse, that is enough to change how a working day goes. For the multi-year financial model or the company-wide reference board, the export button is doing exactly the job it was designed for.